


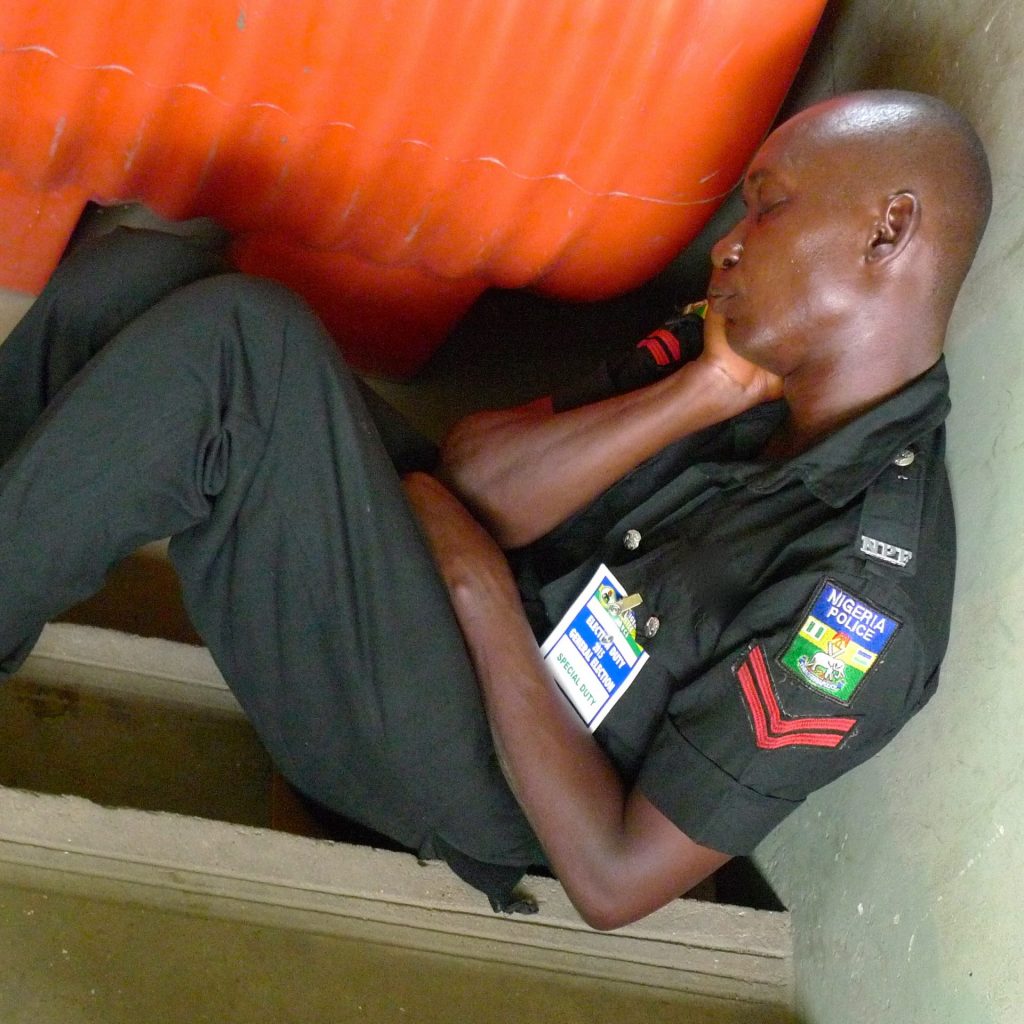
Many people in Nigeria are more afraid of the police than they are of armed robbers. Especially the Special Anti-Robbery Response Squad (SARS) is infamous for its torture practices. In a rare demonstration of unity, the past week Nigerians all over the country have been protesting against this feared police squad, under the hashtag #EndSARS. Police brutality in the West-African country has been stated in many reports over the years by Amnesty International and Human Rights Watch, but statistics from local sources about it are hard to find. I wondered why.
Searching on the internet, I found two datasets that are in some way related to the topic that stem from Nigeria. The first comes from an economist and data analyst based in Abuja and has been often quoted in news reports about #EndSARS, the other comes from the Nigerian Police Force. Let's first take a look at them separately and then see if the two can we in some way interlinked.
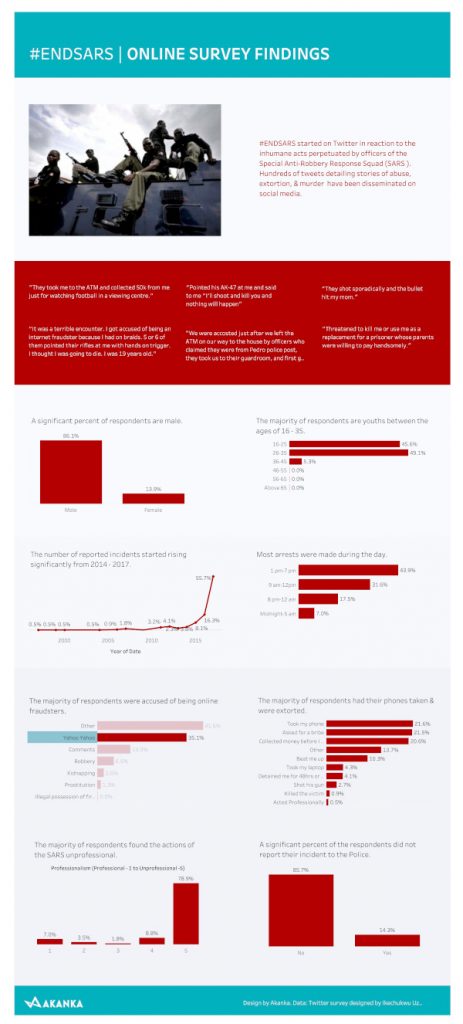
Dataset 1 - #EndSARS. An Online Survey
The dataset represents respondents' experiences with SARS. The title alone leaves not much to the imagination. By quoting the activist hashtag under which the protests against the police squad have gathered steam, the maker makes it clear that this dataset has been gathered to make a point. This in itself is not a problem, when you keep that in mind when interpreting the presented data.
The second issue with the survey published in 2017, is the methodology. The document does not make clear how the data was gathered. After some digging in the history of the author's Twitter page it turns out that he invited people through that medium to partake in an online survey on the website Surveyplanet. Of course such a sample can hardly be called representative. The fact that the absolute number of respondents also is not indicated, makes it even less trustworthy.
Are more women than men harassed by SARS? Is the age bracket between 16 and 35 more affected? Although the graphs seem to give an answer to that question, it cannot be trusted.
Taking a closer look at the questions asked, shows another problem with the outcome. First of all even if you ask the question Have you ever had any problems with SARS with NO, the survey still
follow up with questions as through you have experienced problems. That in itself makes it impossible for the survey to come out anything else but negative on SARS.
Sympathetic as the initiative might be and truthful as the outcome might seem to anyone with knowledge of the local situation, any journalist or academic would be wise to stay away from quoting this dataset.
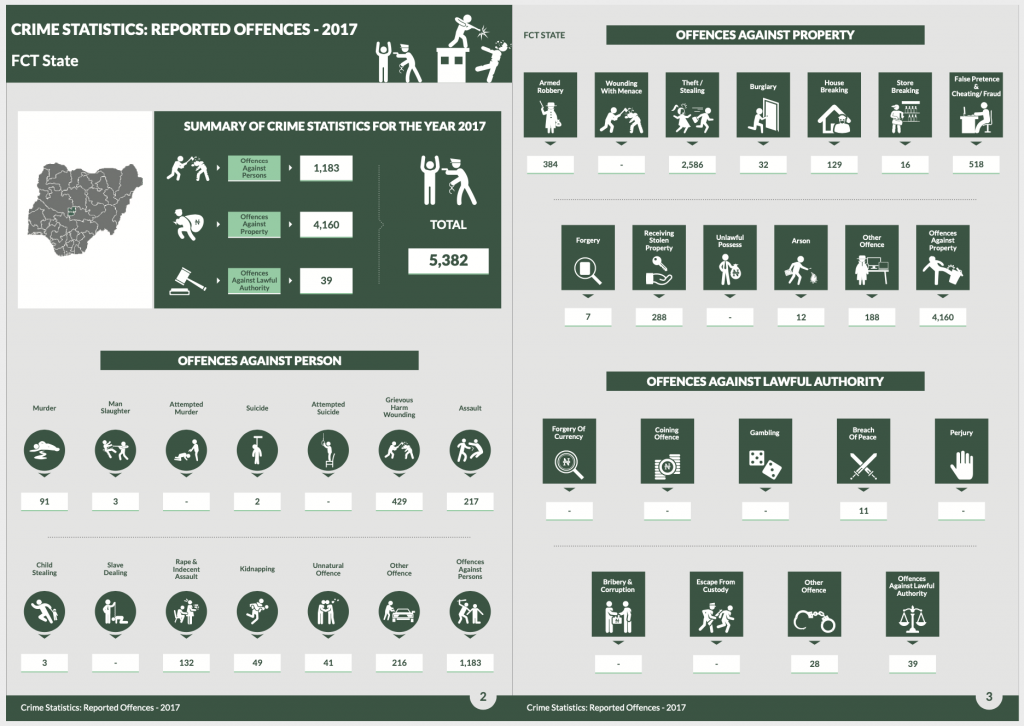
Dataset 2 - Crime Statistics: Reported Offences by Type and State
Is there any trustworthy qualitative and quantitive information about the occurrence of incidents of abuse by SARS? To follow up on that question, I went directly to the source: the Nigerian Police Force. The NPF hands in data every year to the National Bureau of Statistics, that then turns it into an annual Crime Statistics Report. It is the only statistical information made available by the NPF. The most recent one I found online is of 2017, the same year as the first dataset discussed.
The first impression when browsing through the dataset, is that a graphic designer might have been enjoying himself a bit too much and went overboard: the overload of different icons make it harder to go through the information, whereas the use of graphics normally is to clarify and visualise. Also dazzling is the sheer number of pages of graphs: 124. One almost wonders whether the graphics, rather than showing something, are trying to hide it.
On to the content of the visualised information. The data mostly involve occurrence and type of crime per Nigerian state. Unfortunately none of these categories include any kind of offence that harassment by law enforcement officers could fall under. Where the Dutch police in their yearly report includes an entire chapter on this, in Nigeria there is no such accountability. Also, even though in every state the number of police officers and their ranks is stated, nowhere it mentions how many of them work for special squads like SARS. Sometimes what is not in a stat says as much about an issue as what is.
What is in the report though? In spite of the abundance of graphics, the data have not been contextualised. It is impossible to tell whether numbers have gone up or down in comparison to previous years. Nor does it mention rates. The number of crimes relative to the number of inhabitants per state could tell much more about actual occurrence of crime in a state than bare incident counts. And all those stats have not even been collated in a total national crime number. It is up to the reader to follow up in order to be able to use these statistics in any meaningful way.
P.S. As I was writing this piece, the news came in that the Nigerian Federal Government had banned SARS with immediate effect. And even though the issue of police brutality is still on the agenda, in this case people's protests did make a change.
Mirjam de Bruijn
October 14, 2020 (20:04)
Statistics can also be completely useless. or they can be based on bad research; still the presentation has power. This is the dangerous part of statistical representations