

Since I can remember, I have been interested in migration. I grew up next to an AZC, which might be a contributor to my interest. Ideological as I am/was, I grew up wanting to be the change of the system. A system that in my eyes treated the immigrants very poorly. As an adult, I know now that the system is not that simple. I still think that it needs improvement, but I know now that the world is not black and white. It is more composed of 40 shades of grey. However, my interest in migration remains, and that is why today I am analysing the FAO report “Evidence on internal and international migration patterns in selected African countries” of 2015.
The first graph I am going to analyse is:
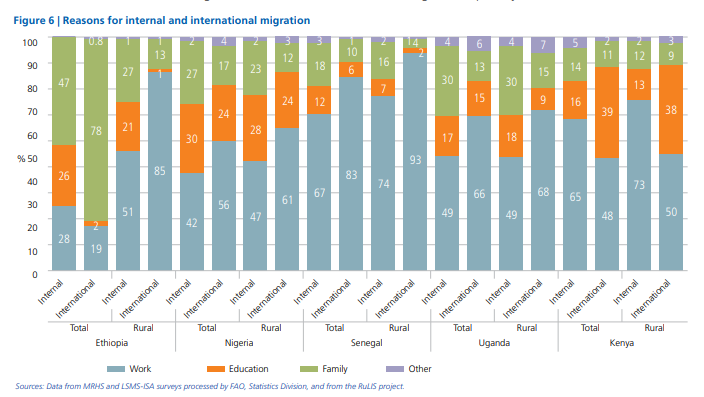
What I see: In Ethiopia the main reason for migration, especially international migration, is family. Education, especially in international migration is a very small reason. For rural migration of Ethiopia, the main factor is work. For Nigeria, work is the foremost reason for migration, and hereafter education. In rural Nigeria these numbers are slightly higher, but with a small difference. When it comes to family reasons, rural Nigerian migrants have less reason for migration than the total. When it comes to Senegal, work is by far the main reason for migration out of all the countries, especially rural to international. Hereafter, family comes in second place, and education and other are smaller reasons. For Uganda, work is also the main reason for migration, with a small increase in migration from rural areas. Hereafter comes family, and hereafter education. The differences are not that big. When it comes to Kenya, the main reason is work. A significant number migrates internationally for educational purposes. Kenya has the highest percentages in migration for educational purposes out of all the countries.
How I interpret these numbers: In Ethiopia, the majority of migrants are women. It is said in the report that women migrate mostly out of family reasons. This could be the reason for the high percentage of family related migration in Ethiopia. Kenya and Nigeria have the highest percentages in migration for education, and for Kenya mostly international. Kenya is a country with more migration from urban areas than rural areas. I tried to find out why many Kenyans go abroad to study, but there is no clear-cut answer. It is mostly said that there is a broken education system in place in Kenya. In Nigeria, students mostly migrate internally for education. This seems quite logical, as it is mostly migration for universities (migration is mainly in age group 15-34). The big and highly ranked Nigerian universities are mostly found in (8 different) bigger cities. Hence, migration. Senegal has the highest international migration for work related reasons. Half of the population of Senegal is under 18. The Senegalese labour force is about 64.8% of the total population, of which 54% is represented in the rural sector. The number of young Senegalese entering the working market is estimated at 269.000, which will only grow. However, it is also estimated that the formal sector creates a maximum of 30.000 jobs a year. This could be a key factor of the high percentage of work-related international migration.
The second graph I am going to analyse is:
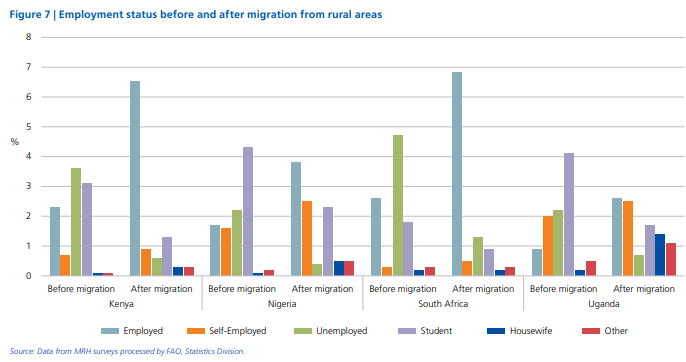
What I see: Employment after migration has increased for every inhabitant that migrated from a rural area. The same counts for self-employment. The numbers of unemployment decreased, and so did the number of students. Furthermore, the percentage for housewife increased as well, except for South Africa. The employment status of migrants before and after migration is the highest in Kenya and South-Africa. However, so is the difference between before and after migration in employment status. Their unemployment status before and after migration is also the highest. The biggest increase in housewife status is the one of Uganda, after migration.
How I interpret these percentages: The reason for the increase of employment after migration, is that it could be the main reason for migration. It is commonly known that there is more work in urban areas than in rural areas, which could also be the reason for the decrease in unemployment. The decrease in student status, is because maybe these students left the rural areas to get a job. In a different graph in the report, it shows that in these countries, the significantly bigger age group that migrates is between 15 and 34. In the figure above this one it is clear that the reason for migration is mostly for work, and less for studies. The increase for housewives, and especially in Uganda, is due to marriage. In the figure above this one, it shows family related migration. Family related migration also includes marriage. Marriage can lead to a housewife status. As you can see, Uganda has a significant percentage that migrates due to family reasons. In the report, it is said that women mostly migrate for family reasons. And in a different figure in the report, it shows that Uganda has a high level of women from rural Uganda migrating. According to the Data Worldbank, Uganda has had an increase in female population between 25-29, and there were (and still are) more females than males in Uganda, and especially in rural areas. Hence, there could be a ‘shortage’ of men in the rural areas, and thus more women migrate to the urban areas to e.g. start a family.
I selected these two graphs, out of 13 graphs. The report covers a lot. I can go in deeper and analyse more. It discusses migration of women, remittances received by households, households with and without migrants owning a house and land, expenditures per household and level of education per household, all comparing households with (internal and international distinguished) and without migrants. All figures seem to be correlated and intertwined. This is interesting, because it makes one think of what is actually all correlated and intertwined, and that we can read one graph with information from another graph. To what extent is this possible? Is it possible that in the end everything is related? Are statistics just as connected as the world is connected through migrantion?
Links:
http://www.fao.org/3/a-i7468e.pdf
data.worldbank.org
Mirjam de Bruijn
October 15, 2020 (08:01)
Reading these statistics is indeed not easy. I wonder also what is now the advantage of having all these figures? how would it compare to a report based on longer interviews?