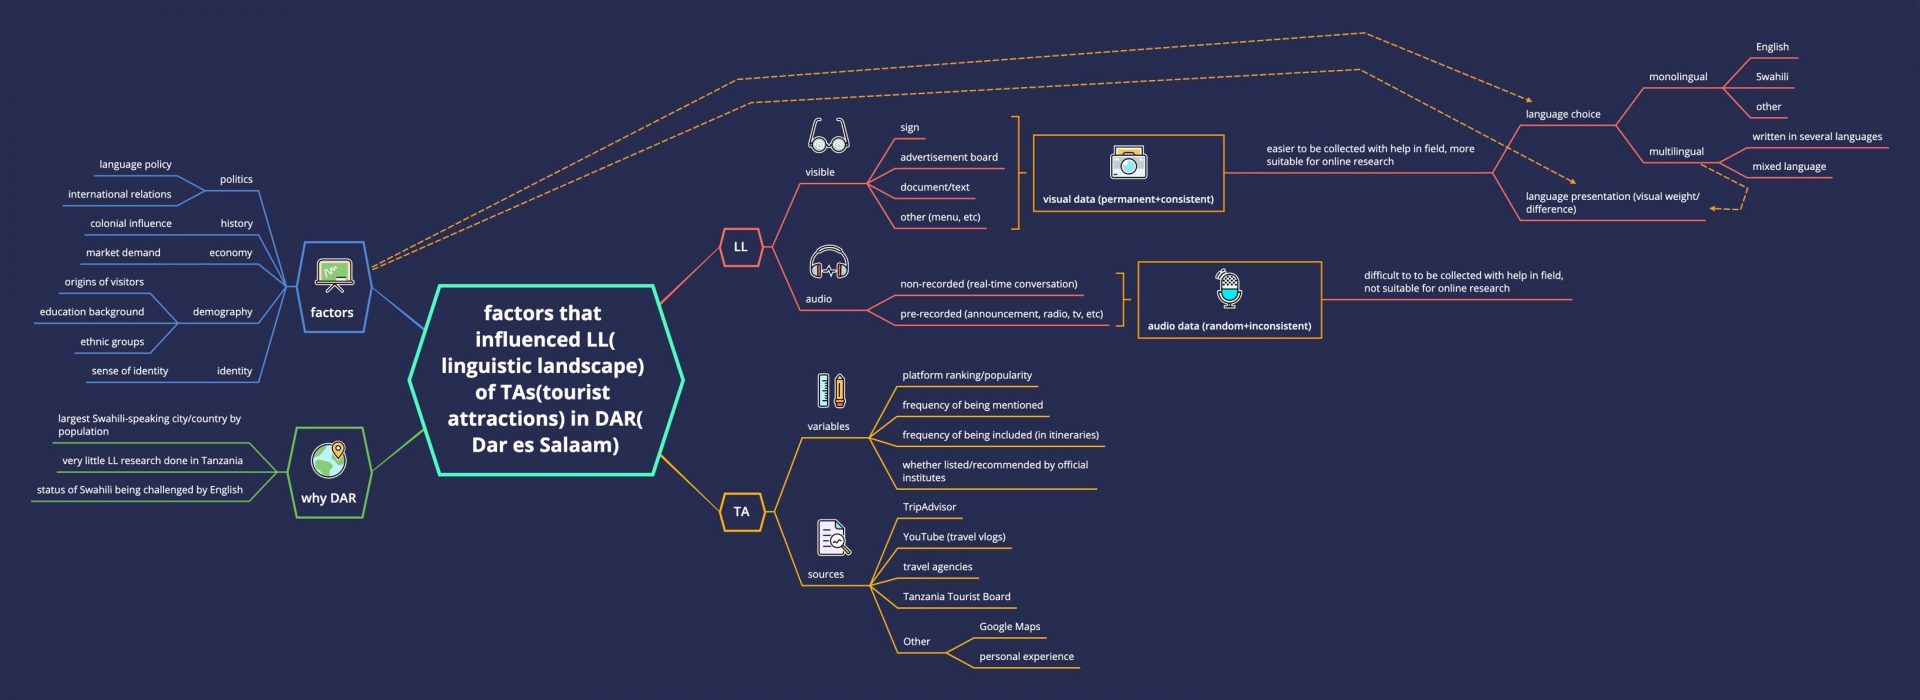
This is my first time visualising my data utilizing a mind map. Even though I have not yet started collecting my data in the field (online) or actually started writing my thesis, I have had a general framework for my research. However, all the logics and relations between each sub-topic within my research have been messy until I managed to draw the mind map below.
Drawing the mind map really helped me organise my mind and my research process by visualising each other’s relations. As I continue my research, I will keep my mind map with me and update it regularly to keep my mind clear. As you can see, this map is almost a graphic mini version of my research.
Once I have collected my visual data (photos) of the linguistic landscape, I will use some visual method(s) to organise them. I believe visualising the data will greatly benefit me in clearing my mind and making my thesis writing more logical and efficient.
You may click the picture below to browse it full screen.
(I created my mind map by using an app called XMind)